Listen to this blog
The COVID-19 pandemic created unprecedented challenges for retailers and manufacturers, while also causing unexpected changes in customer behavior. Customers are now more conscious about their purchases and conduct detailed research before making a decision especially when it comes to high-value items. Since the onset of the pandemic, customers’ purchase channel preferences have evolved. A major proportion of customers have switched to online shopping for long-lasting, durable items which they previously preferred to purchase from physical stores.
Our team of experts analyzed shifts in customers’ purchase patterns, product & brand preferences, and price-sensitivity in the pandemic era for slow-moving durable items. To visualize and understand the evolving change, our experts identified a model enterprise as a leading specialty retailer in North America. Our analysis compares pre- and post-pandemic data for all transactions and customers in the selected period. Sales patterns for both periods are analyzed and compared to see how trends in customer behavior have evolved. Equal duration has been selected to normalize any impact of cyclical promotions or holiday purchases to ensure that similar seasonal trends are being captured for both these groups.
Sales Behavior
Initial analysis shows that the number of new customers post-pandemic increased by 17% overall in comparison to new customers in the pre-pandemic phase during the same period last year. As more customers were coming in, sales revenues also increased by 30% in the post-pandemic time period. The graph below summarizes the contribution of pre- and post-pandemic customer groups in terms of sales, number of customers, transactions and quantity purchased. We observed that the post-pandemic customer group is contributing more across all dimensions.


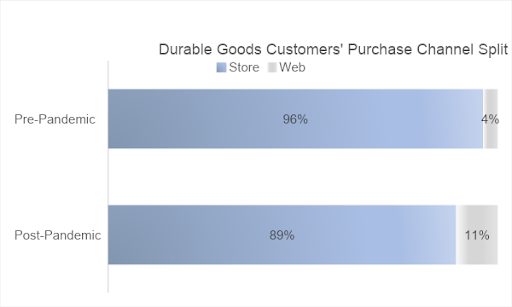
Pre-pandemic customers were not comfortable in purchasing slow-moving, durable products online. However, the onset of the pandemic seems to have swayed their channel preferences. The chart below shows how the purchase channel split has changed after the pandemic.

This highlights the importance of maintaining an effective online presence to ensure that the online shopping experience for durable goods offers ease-of-navigation, convenience, and support to customers. This enables customers to browse for products with ease and complete their purchase journey seamlessly.
Product Preferences
Let’s take a look at the evolution of product preferences amongst customers after the pandemic. From the graph below we see that promotional products have seen an increase in sales after the pandemic in both mediums; online and in-store.

Deep-dive into Website Behavior
With this information, it is worthwhile to deep-dive into website purchase behavior of post-pandemic customers as the online purchase channel witnessed a huge increase after the pandemic. The graph below shows the overall AOV across store and web channels. We observe that AOV from website purchases is less than half of the AOV from store purchases.

It is also important to note that the promotional products which have gained more traction in terms of sales via web are lower-priced than those that have seen an increase in-store.
A deep-dive into product categories sold online reveals that customers are buying more of the main product categories online after the pandemic than before. The table below shows the percentage of customers who have purchased different products categories online, before and after the pandemic.

We observe that customers are buying more from the two main product categories after the pandemic than before and they are buying less of the complementary categories online.
Post-Pandemic Price Sensitivity
Preference for Promotional Products
The section above highlighted that there is a higher price sensitivity in post-pandemic customers. To illustrate this further, a deep-dive into product type Main Category A, which accounts for more than 49% of the retailer’s total sales, is given below.
We observe from the table below that there has been a shift in terms of sales proportion between Premium products and Promotional products for Main Category A. After the pandemic, customers have switched from Premium products of this category to Promotional products. The increase in sales from Promotional products after the pandemic amounts to 15% while the decrease in sales from Premium products amounts to 17%. This reflects a very direct shift in lower-priced items among 54% of the customers who purchased after the pandemic. Previously, only 34% customers purchased products from the Promotional line.

Post-pandemic, the shift in customer-behavior and price sensitivity is apparent. We also observed another interesting fact that pertains to Luxury products. Almost half of the revenue is from the sales of Luxury products for Main Category A, even though fewer customers buy Luxury products.
This goes on to show that the price sensitivity phenomenon cannot be generalized across all customers and all products within a particular category. Some customers, who might be more brand conscious or less price sensitive still prefer Luxury products, while other customers seem to have swapped Premium items in favor of the Promotional ones.
This insight is important because it reflects that the retailer has a diverse customer base; some of them are price sensitive while others are more brand conscious and prefer Luxury brands.
Higher Discounts
Another trend we observed was that post-pandemic customers availed higher discounts than pre-pandemic customers. The graph below shows the overall discount % availed on Main Category A by pre- and post-pandemic customers. Overall, customers availed 4% additional discounts after the pandemic. The discount availed was higher for post-pandemic customers who purchased from the web. These customers availed 8% more discounts than their pre-pandemic counterparts.

The Importance of Brand Loyalty
While we observed a shift towards promotional products for some customers, it is also worthwhile to observe if there is an impact at the brand level. This would highlight if customers are moving from certain brands with more premium offerings and moving towards brands with more promotional offerings.
Deep-diving into top brands from the Main Category A, we observe some trade-offs between brands in post-pandemic customers. From the table below, we observe a share increase for some Mixed brands offering promotional, premium and luxury brands.

Brand A from the table above shows no significant difference in terms of quantity purchased by pre- and post-pandemic customers. However, breaking down Brand A into its segments reveals some interesting findings:

At the overall level, 30% of the products customers bought were from Brand A and this proportion has remained the same even after the pandemic. So, Brand A did not lose overall share in terms of total quantity purchased. However, what’s more interesting is that the proportion of Promotional products of Brand A saw a 9% increase while Premium products of the same brand saw a 9% decrease. An interplay between the product line was observed for Brand A which in-turn allowed the brand to retain its position as the biggest brand in terms of quantity sold even after the pandemic.
This finding points to the importance of brand loyalty especially in post-pandemic times. If Brand A did not have strong brand loyalty, customers would have shifted away from buying its premium products towards another brand. Due to its strong brand loyalty, customers chose to shift to the same Brand A’s promotional offerings instead of switching brands.
This also highlights the need for having a diverse product offering in the post-pandemic world; if Brand A did not have a promotional product line, customers on the lookout for promotional items would have been forced to shift to other brands thereby reducing the share of Brand A after the pandemic.
Summarizing the Pandemic’s Impact on Customer Behavior
We observed significant growth in online transactions and found that some customers have become more price sensitive and avail higher discounts after the pandemic. Our analysis also revealed another customer segment which is less price sensitive and continues to purchase high-value products even after the pandemic. These findings showcase the need to cater to price-sensitive and brand conscious customer segments as both have a significant contribution to the organization’s overall revenue.
We also found that brand loyalty and product mix played a key role in a brand’s growth and share of value after the pandemic. It is therefore critical for other brands in the durable goods industry to offer a diverse product mix in order to capture a bigger share of the growing market.
Data-driven insights such as these assist strategic decisions and shed light on how to target customers efficiently given their transformed shopping behavior since the pandemic.
For more information on retail analytics and actionable, data-driven insights tailored to your organization’s goals and objectives, reach out to the Visionet team below
Writer: Marium Gohr Fawad
Contribution: Asad Mahmood


